release notes
Why Dividing a Month by Four Isn't a Weekly Forecast
July brings forecasting by week that never breaks your monthly total; reports you build on any business data and fold straight into the plan; and a rebuilt Stock Overview with days on hand at every location.
Lakhveer Singh Jajj
Ask a planner how they forecast a week and you'll usually hear some version of the same thing: take the month, divide by four, adjust by feel.
It produces a number, but it throws away everything the forecast knew about seasonality, and it lives in a spreadsheet nobody else can see. Demand doesn't arrive evenly. Promotions land on a Tuesday. Black Friday is not one twenty-eighth of November.
July was about closing the gap between the plan and the grain the business actually runs on.
Forecast by Week, Without Losing the Month
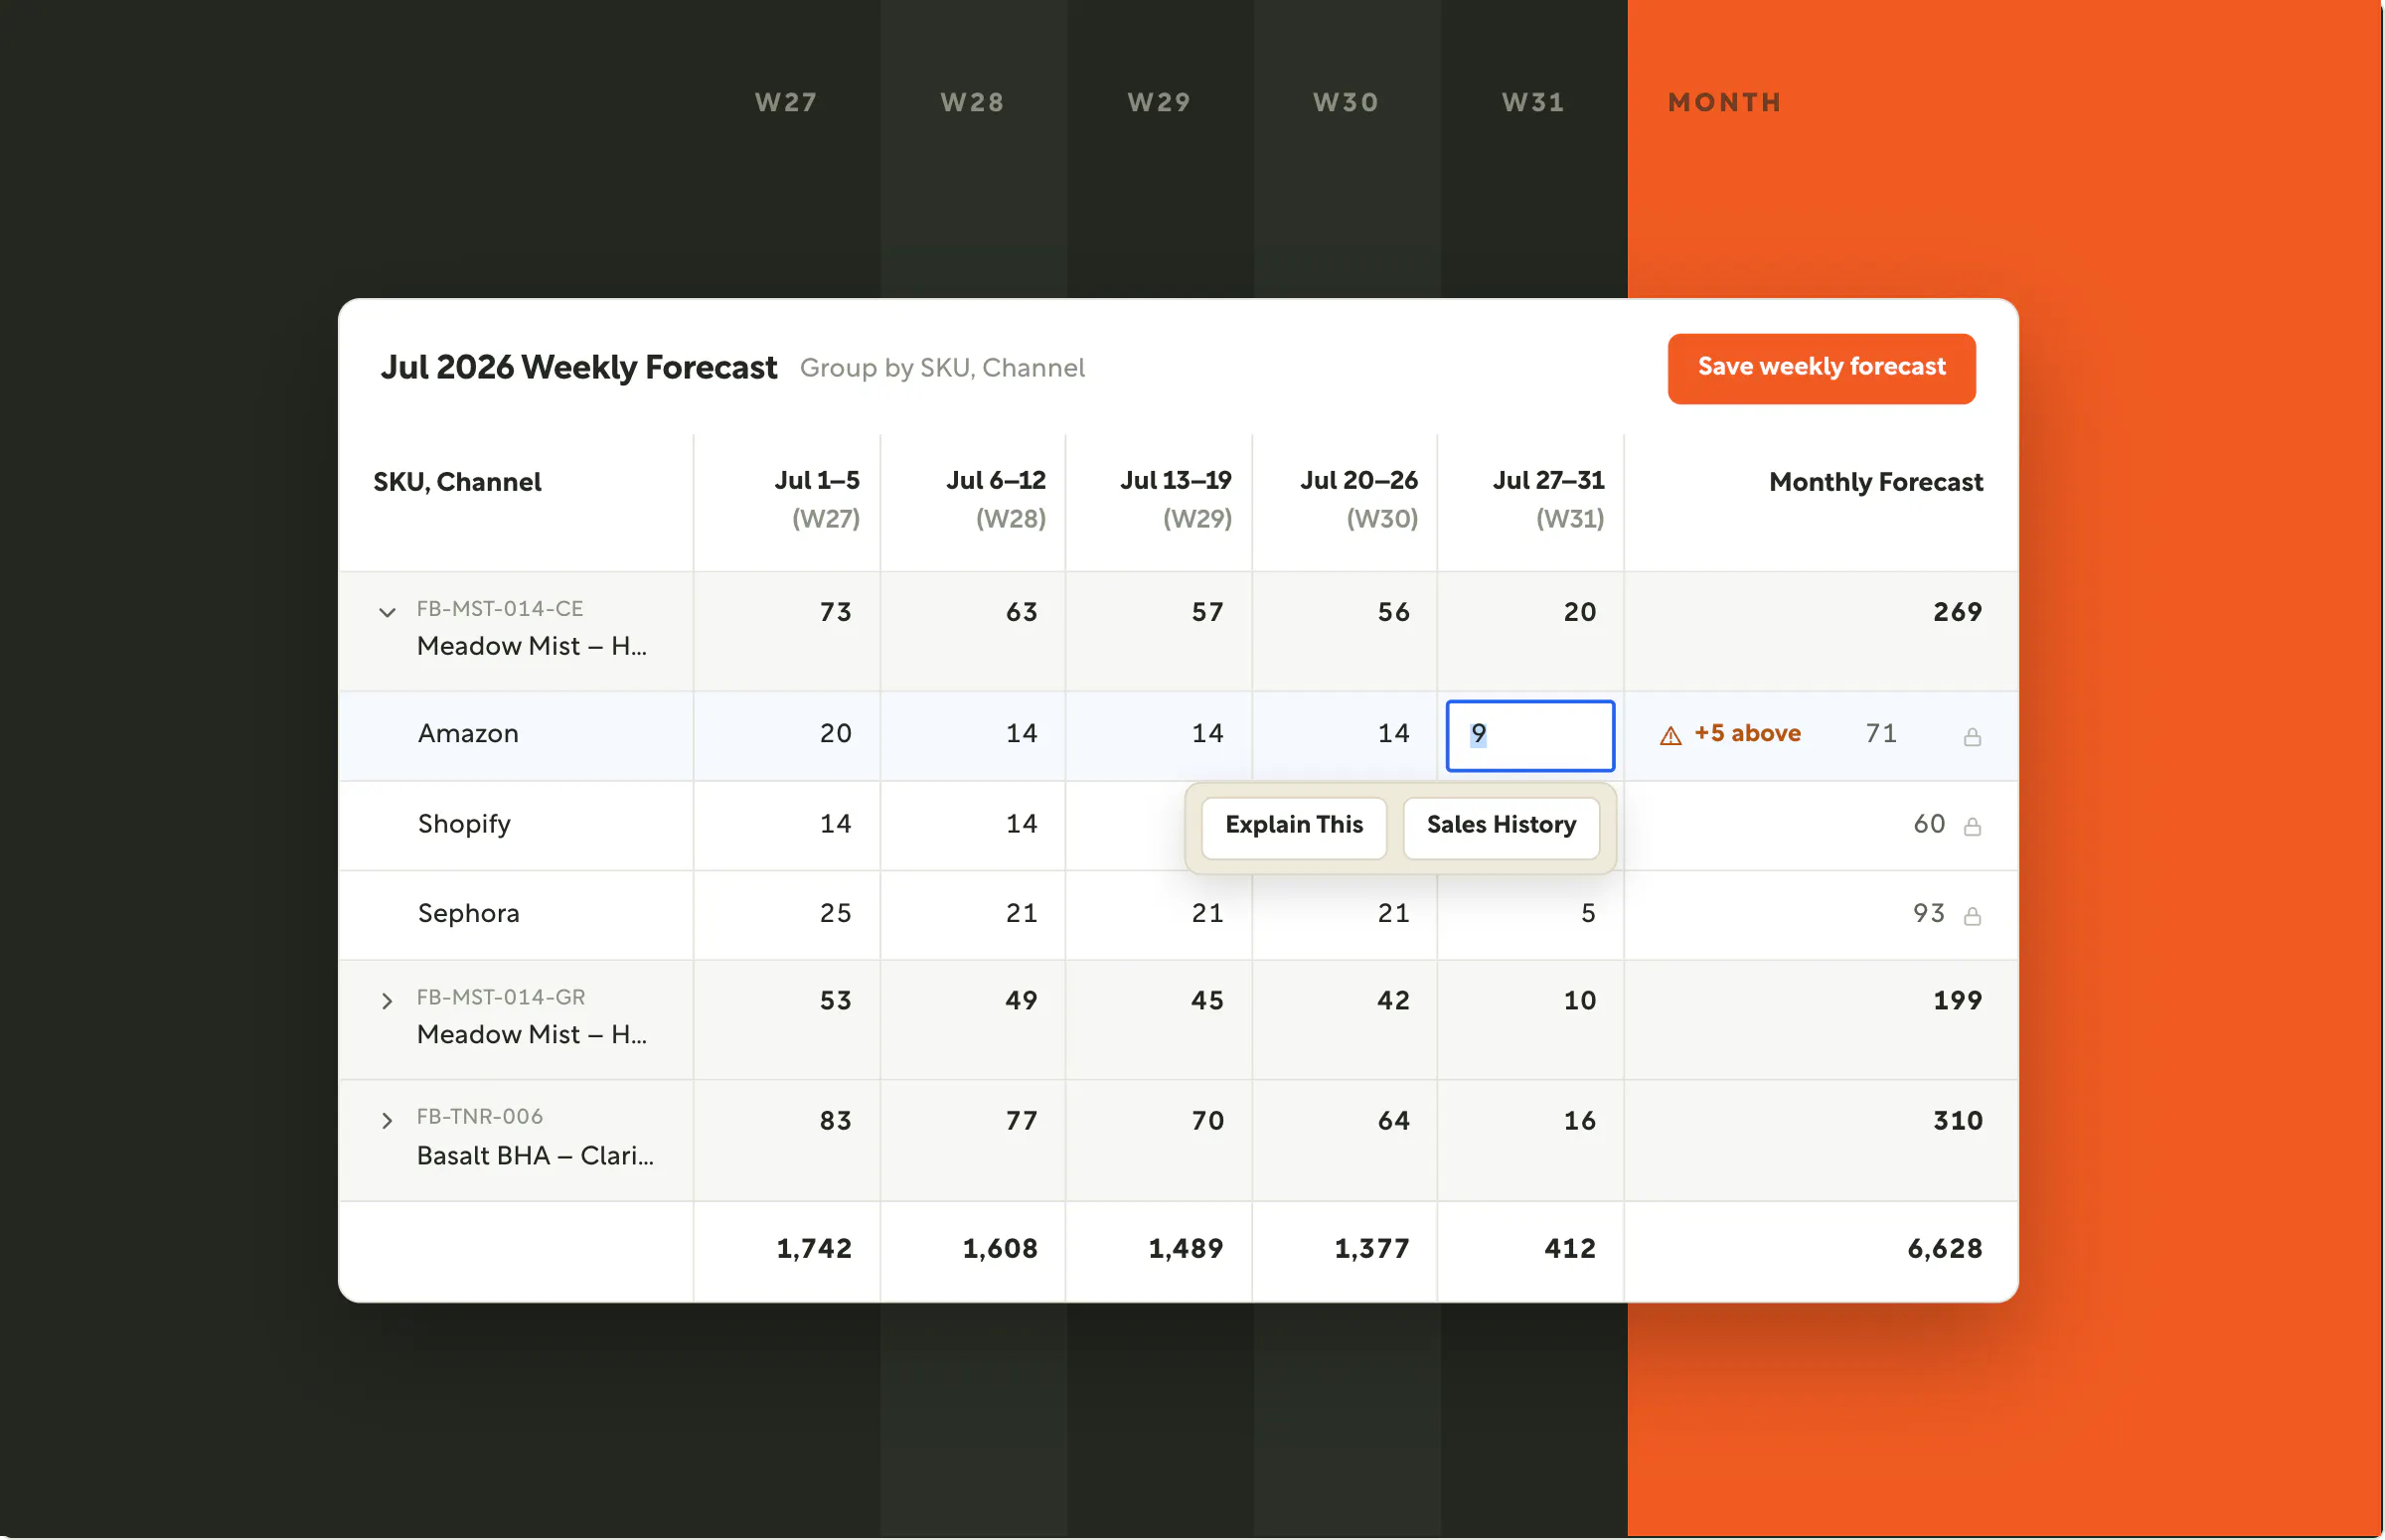
Hover any future month on the planning page and click Forecast by week. The month opens into its weeks and you shape each one by hand — put the promo spike in week three, not spread flat across four.
The constraint is the point: your weekly numbers always roll up to the monthly forecast. The month stays where you set it — only the shape inside it changes, so weekly detail can't drift your annual plan out from under you.
- Only where you need it. Weekly everywhere is noise. Open the two or three months where timing actually matters and leave the rest monthly.
- It feeds replenishment. Weekly detail sharpens order timing, so you stop bringing inventory in a month early to cover a stockout that was only ever going to hit in week three.
- It uses your retail calendar. Weeks match how your business already reports, so the numbers reconcile with everything else on the table.
Build a Report on Anything, Then Put It in the Plan
June gave you Explore: describe the report you need in plain language and Mo builds it on whatever data you've connected — sell-through, inventory, orders, marketing spend.
July closes the loop. Any card you build can now be folded into the forecast. A finding stops being a screenshot pasted into a Slack thread and becomes an input to the plan.
- Build on any business data. Explore reads across the datasets in your account, so the question you ask isn't limited to the reports somebody built in advance.
- Fold it into the forecast. Push what you found straight into the plan instead of re-keying numbers into a spreadsheet and hoping they survive the trip.
- Save the view you work in. Custom filtered views and grouping by any metadata field you've defined, so the slice you plan against is one click away.

Know Exactly What You Hold, and Where
Multi-location brands need planning software the most and get blended numbers the most. One days-on-hand figure across four warehouses tells you nothing when three are full and one is running dry.
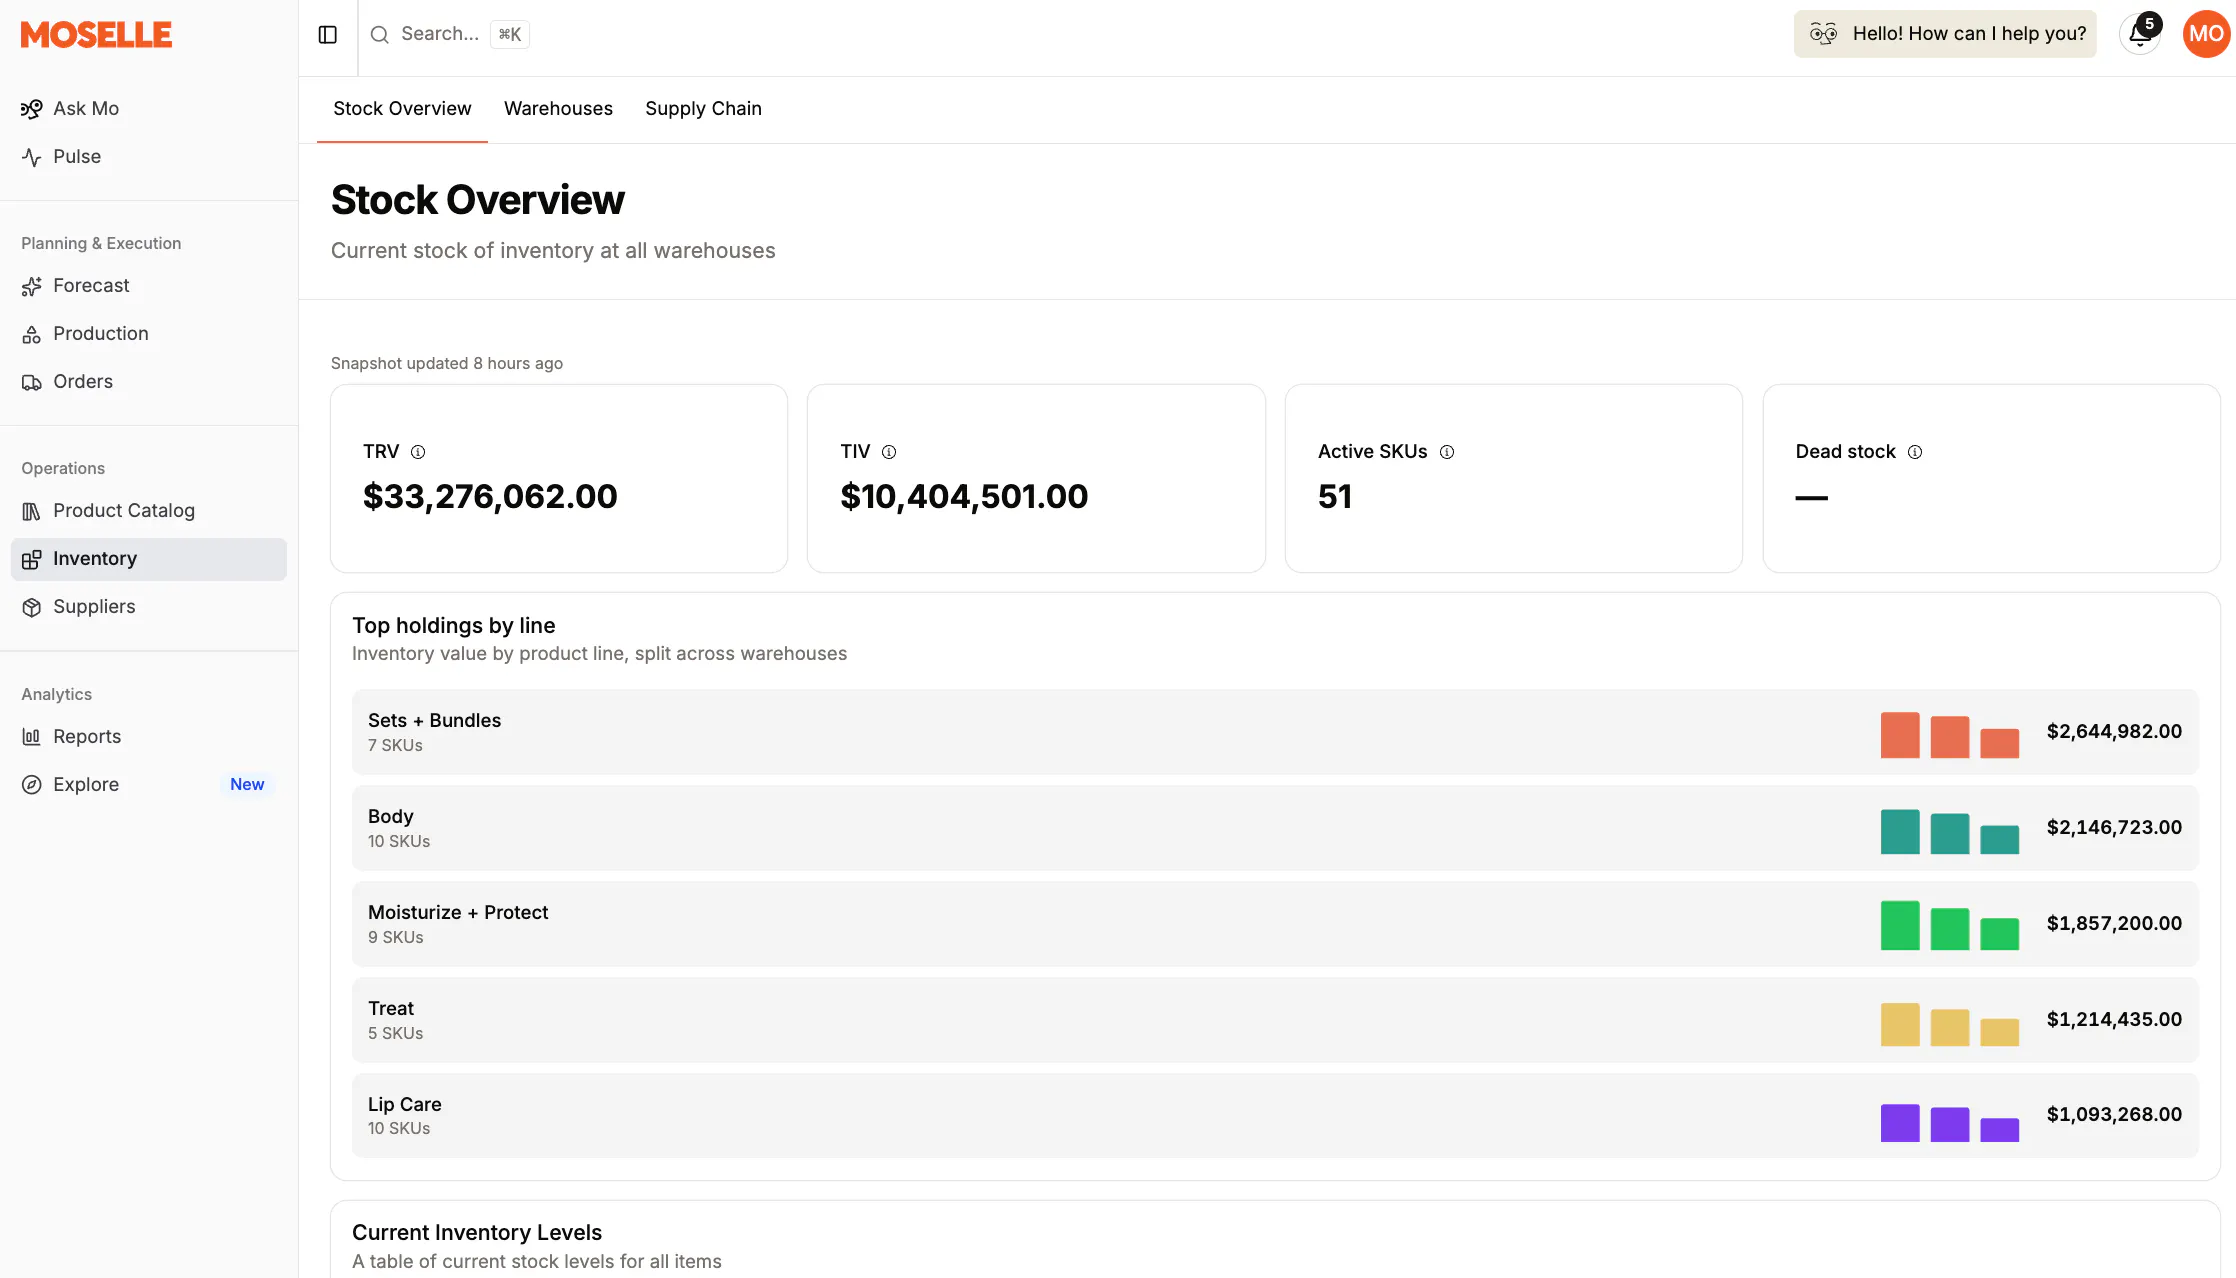
Stock Overview is rebuilt on live warehouse data: retail value, inventory value, active SKUs and dead stock across every location, above a searchable table of on-hand and incoming units.
- Days on hand is now per location. Months on hand too, and both surface in the SKU hover card wherever you are in the app.
- Dead stock is visible early. See the value tied up in SKUs that aren't moving, before it becomes a write-off conversation.
- You always know how fresh it is. A snapshot timestamp sits on the page, so nobody plans off yesterday's numbers.
Everything Else We Shipped
- Bring the stack you already have. A new ingestion engine reads items, sales, inventory, suppliers and purchase orders from Snowflake, Qlik Sense and systems we may still be building a connector for. Ingested locations arrive as real warehouses, with their inventory and links intact.
- Amazon Vendor Central Analytics. Vendor sales, inventory and the Sourcing view pulled in and matched to your items by ASIN — a full 1P picture rather than just orders.
- Meta Ads. Marketing spend sits alongside demand, so a campaign and a stockout stop being two separate conversations.
- Mo got smarter, and more honest. Better reasoning on multi-step planning questions and stronger memory across a thread, plus guardrails so Mo describes features that exist rather than inventing settings.
- Credit tracking, so you know where you stand. See your Mo usage broken down by category and period, and set your own overage limits — so a heavier month never arrives as a surprise.
- Catalog exports arrive by email. Large exports run in the background and land in your inbox instead of timing out in the browser.
- You'll know when data is behind. The forecast report flags a lagging sync, so you never plan off stale numbers without being told.
- Retire a warehouse without losing its history. Archive a location and keep everything it held. Colombian Peso also joins the master currencies.
One More Thing
Weekly forecasting exists because brands kept telling us the same thing: the monthly number is right, and still wrong for the week that matters. If there's a version of that in your planning — something you do by hand because the tool's grain is off — I want to hear it.
New to Moselle? Bring the stack you already have — Snowflake, an ERP, a warehouse nobody's touched in two years. We'll show you a forecast running on it. Book a demo.
Already with us? Try weekly forecasting on a duplicate of your current plan before peak. It takes about two minutes and won't touch your live forecast.