release notes
Your Supply Chain, Mapped and Planned in One Place
August brings the Supply Chain Network — group warehouses into regions, give every lane its own lead time, and cover transfers in the same plan as supplier orders; a Mo that reads an Excel, CSV or PDF file and applies it where you're working; and channel-level pricing that reaches the forecast.
Lakhveer Singh Jajj

Ask most planning tools where your stock should go and they answer for one warehouse at a time. Real networks don't work that way.
Product gets made at a supplier, lands at a hub, moves out to a regional warehouse, and sells through a channel that pulls from whichever location happens to have it. Every arrow in that chain carries its own lead time. Any one of them can be the reason a SKU is short in Toronto while a pallet of it sits in Reno.
August was about planning the whole network — and about Mo doing more of the work once the plan exists.
Draw How Product Actually Moves

The new Supply Chain page is a visual map of your operation. Drag on suppliers, warehouses and channels, connect them, and you have described how product actually moves through your business.
Moselle then plans against that map rather than against a single location. Below the canvas, the same information breaks out into tables — lanes, sources, stock policies and regions — so you can work with it as a list when the picture gets busy.
- Regions split demand properly. Group warehouses into a region and demand spreads across them, instead of landing entirely on whichever location the channel happens to be wired to.
- Lanes know how long the move takes. Every connection carries its own lead time, so moving stock between your own locations gets planned with the same rigour as a supplier order.
- The plan turns into real orders. Place from the supply plan and Moselle writes actual purchase orders and transfers — no re-keying into another system to make it count.
Hand Mo a File, and It Lands Where You're Working
Mo has been able to edit your forecast for a while. What changed in August is where the numbers are allowed to come from.

Attach an Excel workbook, a CSV or a PDF — a stock count, a supplier's price list, a product catalogue — and Mo reads it and applies it to the thing you're already working on, rather than handing you an import template and a list of formatting rules.
- Any layout, not a template. A 3PL export, a cycle count, a supplier's report — Mo finds the columns that matter instead of making you rearrange them first, and flags mismatches before you commit. A 50,000-row file is no harder than a 50-row one, and a full-size workbook is fine.
- It lands where you are. On a warehouse page Mo knows which location you mean and updates its stock. Hand it a product list and it builds a catalogue import, showing you a dry run first. On a supply plan it reads and changes the plan on screen. The file goes into the work in front of you, not a generic import queue.
- And it stops where it should. Every change is proposed and waits for your confirmation. Mo also won't touch an externally synced warehouse — that system is the source of truth, so it says so and stops rather than guessing.
A Pricing Matrix That Reaches the Forecast
A forecast in units answers half the question. The other half is what those units are worth, and that depends on which channel sells them and at what price on the day.

August adds channel-level pricing: rules per channel, promotional periods, and discounts that resolve to a real number the plan can use.
- Price by channel, not by SKU alone. The same item can carry different pricing on different channels, including promotional windows, without maintaining a second spreadsheet.
- Read the plan in dollars. Average selling price and suggested retail surface on the forecast table, so revenue sits beside units instead of being worked out afterwards.
- Channels can run their own currency. Useful the moment one storefront sells in something other than the rest of the business.
Everything Else We Shipped
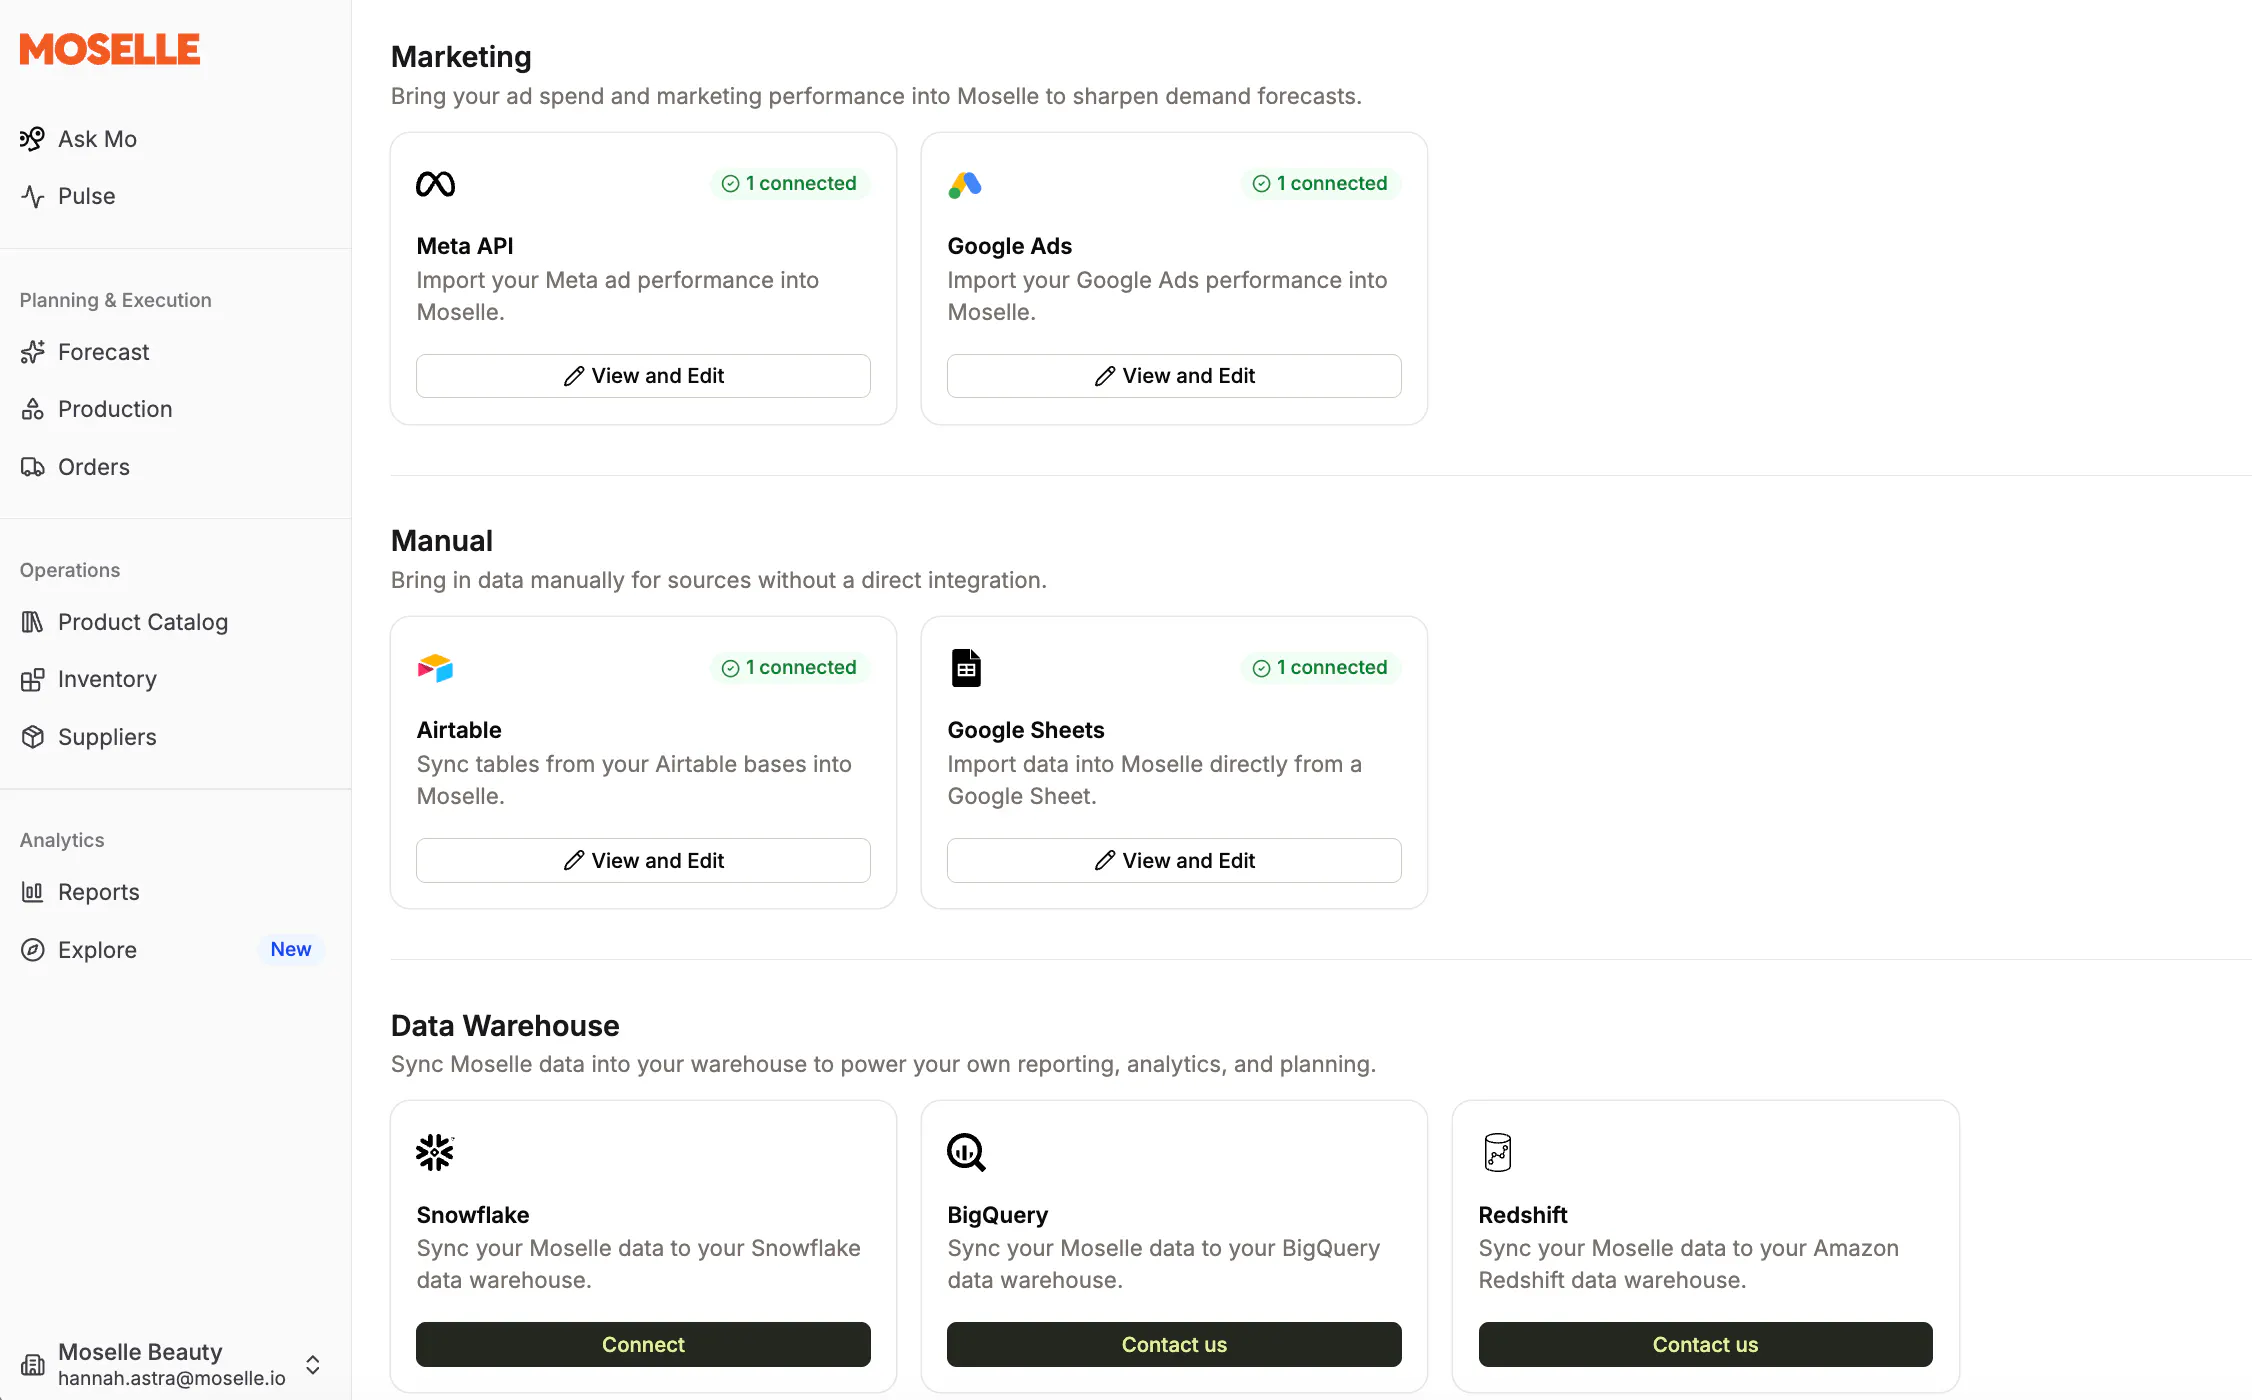
- Four new connections. Google Ads and Google Sheets, Airtable, and Fishbowl — ad spend, the spreadsheets your team already maintains, and a warehouse system we couldn't reach before.
- Push an order to your OMS. Send a purchase order from Moselle straight into ApparelMagic from the order menu.
- Saved views belong to the company now. Custom forecast views live on the account rather than in one person's browser, so the team opens the same slice you did.
- Schedule work for Mo. Set any prompt to repeat on a cadence and Mo emails you the answer when it finishes, with whatever it produced — a workbook, a chart, an export — attached.
- Suppliers describe themselves properly. Say whether a supplier manufactures or resells, whether it holds stock, and which warehouse it actually is — so lead times and sourcing resolve correctly.
- Warehouse pages got faster and clearer. Search and pagination run server-side on stock levels, and synced inbound units now say which integration they came from and when they last updated.
- Forecasts respect launch dates. A new item stops being forecast into months before it existed.
- Faster answers in Sales Performance. Date-range presets instead of picking two dates every time, and the channel chart caps at the top ten so it stays readable.
One More Thing
The network map exists because brands kept drawing it for us on calls — on a whiteboard, in a spreadsheet, once on the back of a shipping label. If your operation has a shape the software is making you flatten, I'd like to see it.
New to Moselle? Bring us the messy version — three warehouses, a contract manufacturer, and a channel that pulls from whichever has stock. We'll map it and plan against it. Book a demo.
Already with us? Map your network under Operations → Inventory → Supply Chain. It takes about ten minutes, and the plan gets sharper the moment it knows what can move where.