release notes
Stop Waiting on Your Data Team to Answer Inventory Questions
June brings Explore, a report builder you drive in plain language; Inventory Pulse, a live read on stock risk across every warehouse; and a weekly briefing from Mo that arrives with your to-do list already written.
Lakhveer Singh Jajj
Most planning teams don't have a data problem. They have an access problem — the numbers exist, but getting a straight answer means a spreadsheet export, a SQL request, or a week of waiting on someone else's queue.
We hear a version of this on almost every call. A brand has years of sell-through, inventory and order history sitting in a warehouse somewhere. They also have a planner who needs to know which SKUs are about to run dry before the next container lands. Those two facts should meet in the middle. Usually they don't.
June was about closing that gap. Three releases, and all three point the same direction: put the answer where the person who needs it already is.
A Live Read on What Needs You Today
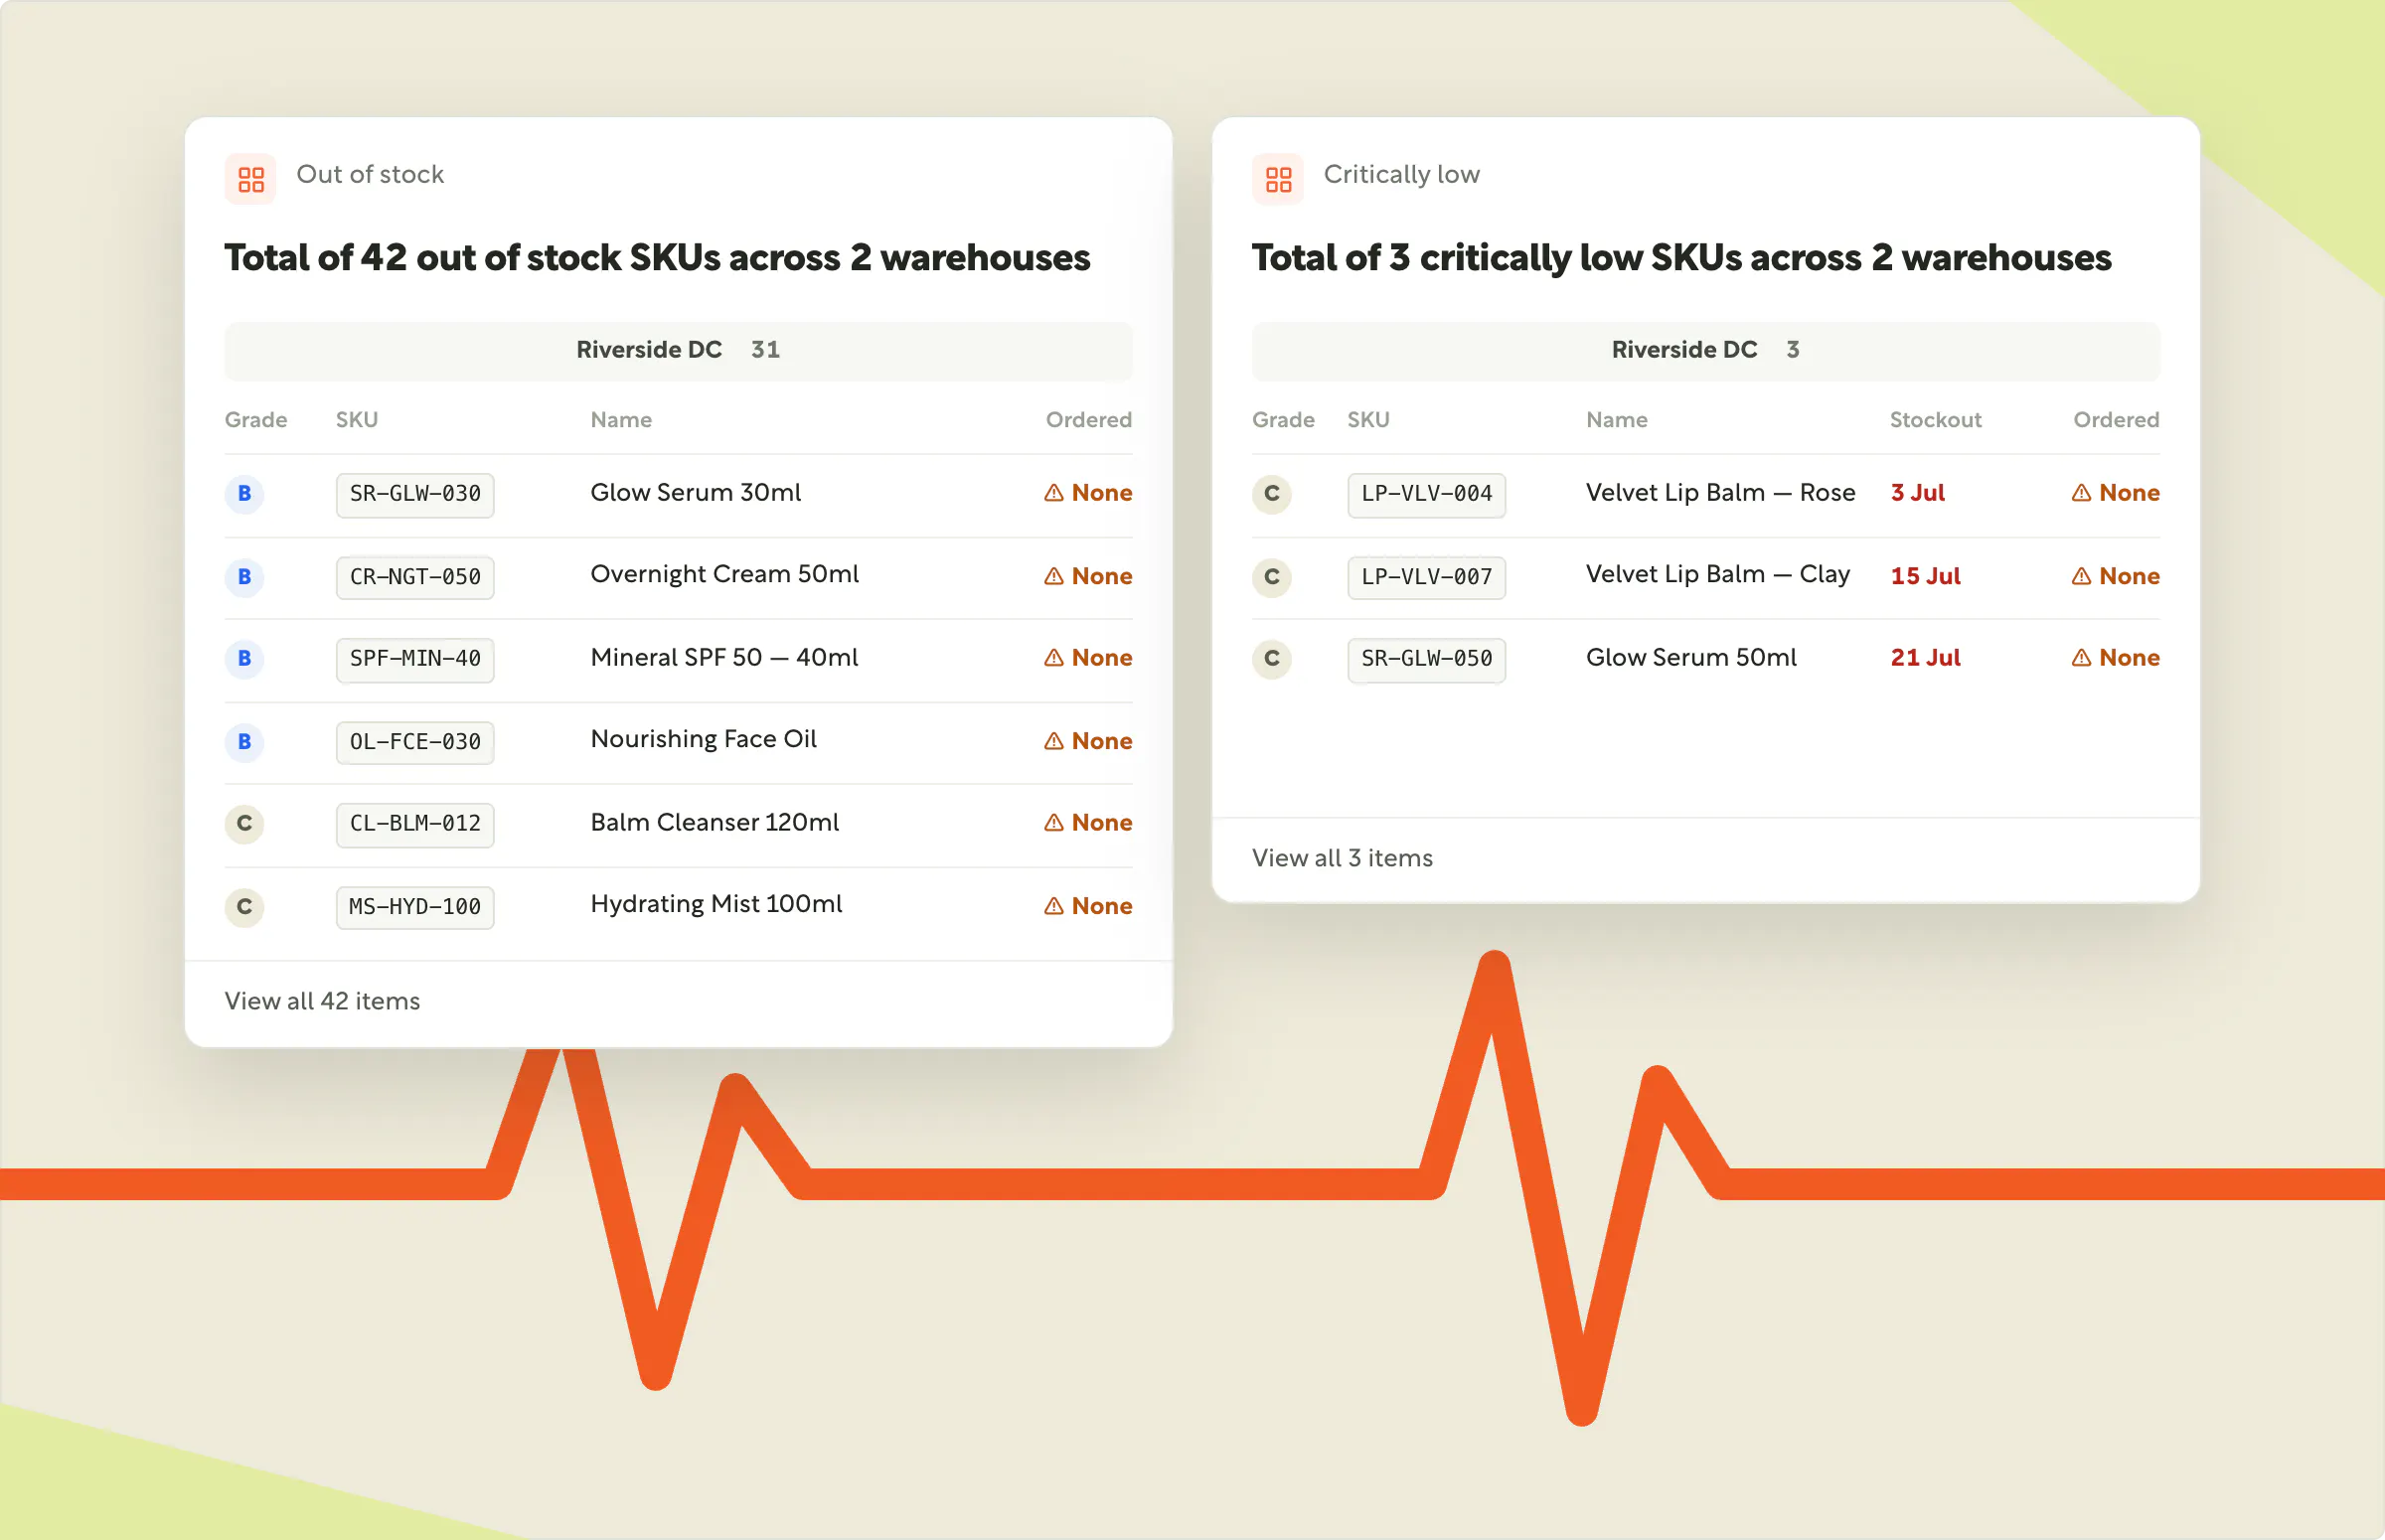

The first ten minutes of a planner's day usually go to reassembling a picture of what changed overnight. Mo's Inventory Pulse is that picture, already assembled — sales month over month, SKU performance, and what's out of stock or critically low, on one page, from live data rather than an overnight snapshot.
- Risk broken out per warehouse. A national shortage and a single-DC shortage are different problems. The out-of-stock and inventory-risk widgets treat them that way, with tabs per location.
- Filter SKUs by warehouse. Narrow to the location you're actually buying for, then click any row through to the item.
- Hand any question to Mo. Every widget is a starting point — see something odd, ask about it without leaving the page.
Build Any Report by Describing It

Explore is a report builder you drive in plain language. Open it, type what you want to see — "weekly revenue by channel for the last quarter" — and Mo assembles the charts and tables on a live canvas. No filter panels, no chart configuration, no query.
The part that matters is what happens next. You keep talking. "Make it a line chart." "Group by region." "Show me the top 20 ASINs." Each request reshapes what's on the canvas instead of starting over, which is the difference between a tool you use once and a tool you actually work in.
- Join across datasets without writing a join. Combine sell-through, inventory and order data in one view — the thing that normally requires knowing SQL and knowing your schema.
- Save it as a report that refreshes itself. Anything you build in Explore can become a saved report on the Reports page, shared company-wide, and it stays current as new data lands.
- Send findings into the plan. Spot something in Explore and fold it straight into a forecast, rather than exporting a chart and re-keying the numbers.
Monday's To-Do List, Already Written
This is the part of "automated inventory planning" that usually isn't automated: someone still has to decide what to look at. So Mo now does that first pass for you.
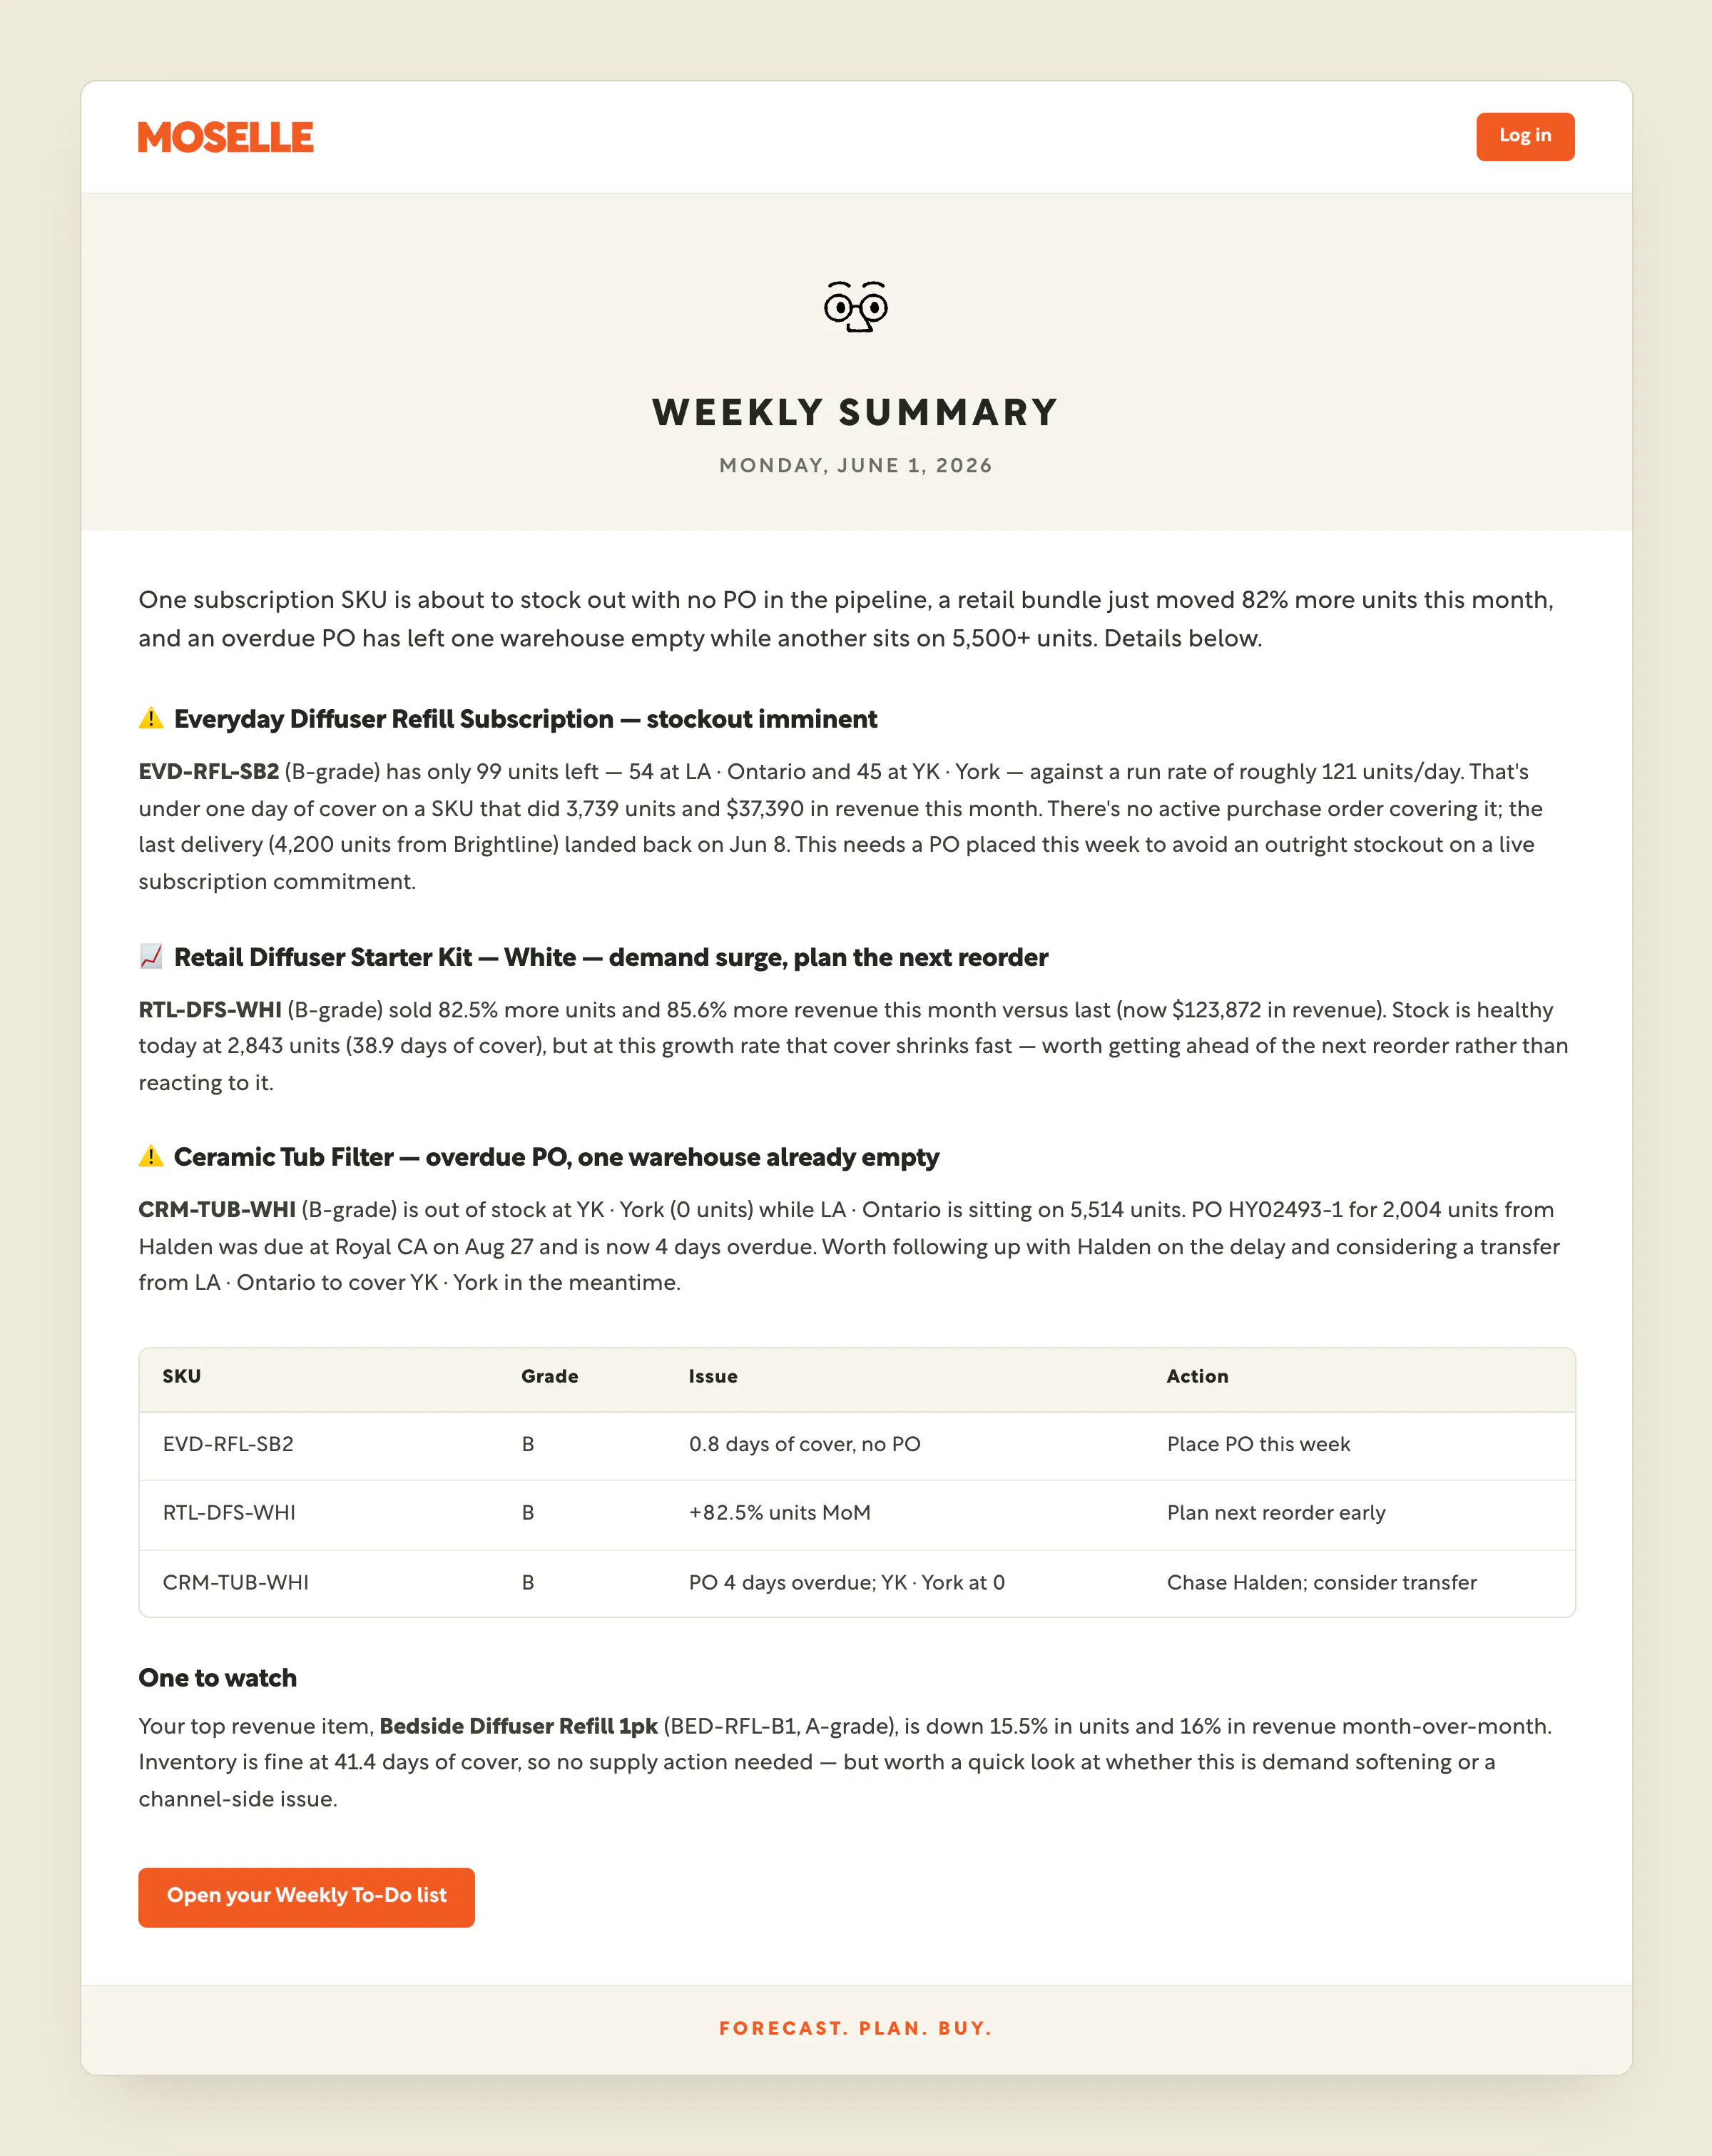
Every Monday, Mo emails a weekly briefing on your business — forecast drift, purchase-order risk, production-plan risk, notable movements. And a weekly to-do list now sits at the top of Ask Mo whenever you open it, with the items Mo has already flagged as worth your attention.
- Four kinds of action item. Stockout risk, POs to chase, low inventory, and sales surges — each with the SKUs, dates and inbound orders that led Mo to raise it.
- Every item opens into the reasoning. Click Ask Mo beside any line to see the full explanation and a recommended next step: expedite, reorder, or reallocate.
- Tune it to your business. Tell Mo what matters — "always keep me across A-grade SKUs and slow movers" — and the briefing reshapes around it.
Everything Else We Shipped
- NetSuite, rebuilt for enterprise. A reworked connector for larger, multi-subsidiary NetSuite accounts — the setup that used to need a scoping call now runs on the standard path.
- Amazon Vendor Central. First-class 1P support: vendor sales, inventory and account-type handling sitting alongside your Seller Central data instead of in a separate spreadsheet.
- Custom dashboards, shared. Build a dashboard, save it, and share it across your company — with owner and visibility controls so the right people see the right view.
- Export anything. CSV export from any dashboard card, plus chart download as PNG or a bulk ZIP for the deck you're building at 11pm.
- Accuracy on the surface. Every forecast model now shows its accuracy score and last-refreshed time, with the current month highlighted — so you know how much to trust a number before you order against it.
- Purchase orders that match your paperwork. Custom amounts on PO export, additional costs carried through to the PDF, and hover cards on production-plan sub-rows.
- Draft orders in production plans. Model an order before it's committed and watch how it moves your coverage.
- Partial rebuild. Re-run one part of a plan, with PO tracking and alerts, instead of rebuilding the whole thing and waiting.
- Import a catalog of any size. Large CSV uploads now complete rather than timing out — which matters most on day one, when you're bringing years of history in at once.
- Syncs on your business day. Inventory syncs are scheduled in your timezone, so the numbers refresh before you start work, not halfway through it.
- Faster search across your catalog. Item and channel search rebuilt to stay in step with your data as it changes.
One More Thing
Every one of these came from a conversation with someone doing this work daily — including the morning checklist above. If there's something you're still doing by hand that you think we should be doing for you, we want to hear it.
New to Moselle? See Explore build a report from your own data in fifteen minutes — no SQL, no implementation project. Book a demo.
Already with us? Turn on your weekly briefing in Settings and tell Mo what you want watched.